 TrakMac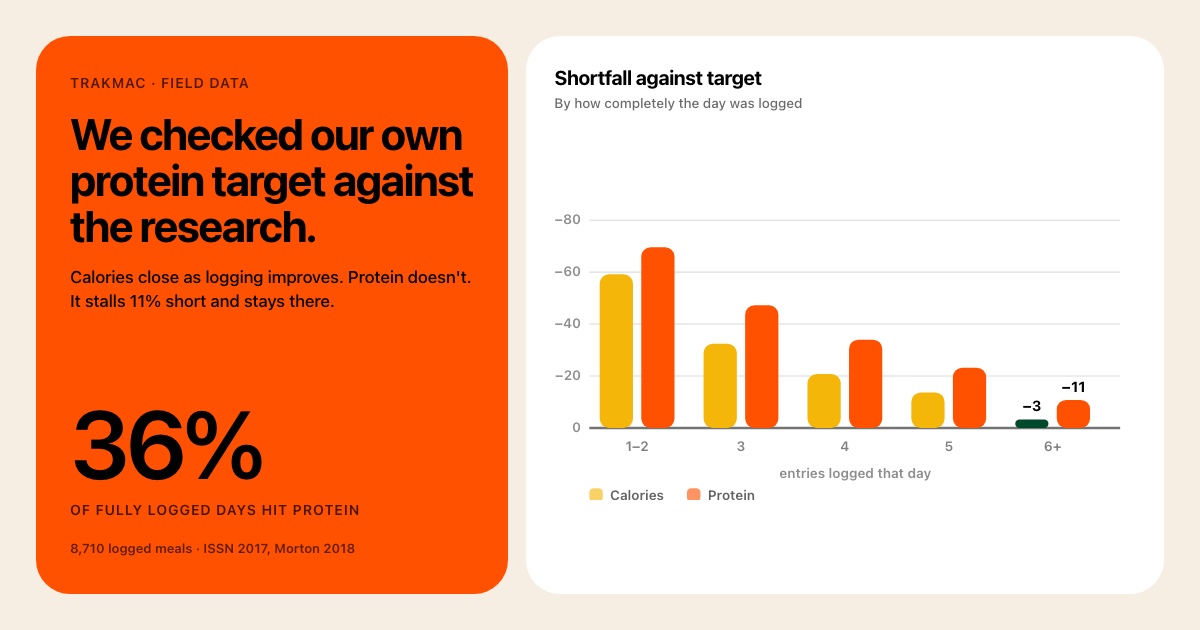
People who track macros will tell you calories are the hard part. Our own logs say otherwise.
We pulled 8,710 logged meals and looked for the days where somebody clearly caught everything they ate: six or more entries, breakfast through the last snack of the night. On those 641 days, calories landed within 56 of target out of 2,109. That is closer than most people can eyeball a portion.
Protein on those same days came up 18 grams short, and only 36% of them reached the target at all.
One macro is solved. The other is not. This is what we found when we went looking for why.
It is not that people stopped logging
The obvious explanation for a shortfall in any food tracker is a forgotten meal. If that were the whole story, the gap would shrink as logging got more thorough and disappear on the days people caught everything.
Half of that is exactly what happens.
| Entries logged | Days | Protein | Target | Hit target | Calories vs target |
|---|---|---|---|---|---|
| 1-2 | 369 | 53 g | 174 g | 0.8% | -1,251 |
| 3 | 251 | 91 g | 172 g | 4.0% | -686 |
| 4 | 292 | 110 g | 167 g | 9.9% | -434 |
| 5 | 252 | 126 g | 164 g | 17.9% | -285 |
| 6 or more | 641 | 140 g | 157 g | 36.2% | -56 |
The calorie gap closes almost completely. The protein gap stalls at 11% short and stays there no matter how carefully somebody logs.
So incomplete logging explains one and not the other. Which means the protein gap belongs to somebody in particular, and it was worth finding out who.
Everyone who misses is on a diet
Splitting the same days by what people were trying to do answers it in one table.
| Goal | Share of users | Protein eaten | Their target | Hit target |
|---|---|---|---|---|
| Cutting | 69% | 0.73 g/lb (1.60 g/kg) | 0.95 g/lb | 15% |
| Maintaining | 22% | 1.10 g/lb (2.42 g/kg) | 1.04 g/lb | 64% |
| Bulking | 9% | 1.01 g/lb (2.22 g/kg) | 1.04 g/lb | 44% |
People maintaining and bulking are doing fine. They land on or above their protein most days without much drama.
The shortfall belongs almost entirely to people eating in a calorie deficit. And that is the group where it matters most.
Why a deficit raises the bar instead of lowering it
The International Society of Sports Nutrition puts protein for building or holding muscle at 0.64-0.91 g/lb (1.4-2.0 g/kg). Morton's meta-analysis of 49 studies found gains in lean mass stop improving past 0.74 g/lb (1.62 g/kg).
Those are the numbers most people have heard. They are also for people eating enough.
The same ISSN position stand raises the requirement for anyone eating below maintenance: 1.04-1.41 g/lb (2.3-3.1 g/kg) to hold onto lean mass through a hypocaloric period. When calories come down, protein is the thing standing between a diet and losing the muscle underneath it.
Our cutting users are eating 1.60 g/kg. Below their own target, and below what the evidence supports for a deficit even after accounting for body composition.
Which makes sense once you picture the day rather than the spreadsheet. Cutting means trimming. Protein is the easiest macro to trim without noticing, because it usually arrives attached to something else you were cutting anyway. Nobody sits down and decides to eat less protein. It just quietly does not show up, and by the time the day is logged there is no meal left to fix it with.
The people who need protein most are the ones getting the least of it. That is not a discipline problem. It is a timing problem, and timing is something an app can actually help with.
About that 0.95
Our target for people cutting averages 0.95 g per pound of total body weight, which looks low next to a 1.04 floor until you see how it is built.
We work protein from lean mass rather than scale weight, so somebody carrying more fat gets a number based on the tissue that actually uses it. Nearly three quarters of the people cutting here fall into the higher body-fat brackets, which is why their figure per total pound sits below a lean maintainer's. The ISSN deficit range comes from resistance-trained, relatively lean subjects, and reading it straight off total body weight for everybody would overshoot.
So the target is not the thing that is off. The distance between the target and the plate is.
Where your number comes from
TrakMac does not set targets from age and weight the way a standard calculator does. It asks what you actually do, what you lift, how you train, how you carry weight, and works from your body composition rather than a demographic average. That is why two people at the same body weight can end up with different numbers.
It is still an estimate, and an estimate about you specifically is exactly the kind of thing you might disagree with. So the number is yours to change. Set your own calorie and protein targets and they stick, and nothing recalculates over the top of them until you ask it to. About one in eleven people has already done this.
The most useful thing here for anyone who tracks anything: if you log completely, you are almost certainly closer to your calories than you think. The days that feel like failures are usually the days you stopped logging at 3pm.
Where this data comes from
We do not look at individuals. Nobody here reads your food log, and nothing in this piece traces back to a person. Every number is an average across hundreds of days, and anything that could not be aggregated did not get used.
What we do look at is the shape of the whole set: whether our targets are set right, whether our estimates hold up, where people get stuck. That is the only way to catch something like this, which was invisible in any single account and obvious across 641 days.
Method
Data: 8,710 food entries logged between 22 April and 31 August 2026, grouped into 1,805 logged days. The headline cohort is the 641 days with six or more entries.
Logging completeness is a proxy, not a measurement. Entry count is the best available signal that a day was captured fully, and it is imperfect. Somebody logging one large combined meal looks incomplete and is not. The gradient across all five bands carries the argument, not any single band.
Targets are TrakMac's own computed values from each profile, so this measures behaviour against our recommendation rather than a clinical standard.
Limits: this is a self-selected group. Everyone here chose to download a macro tracker, which is not the general population. Estimates are derived from natural-language food descriptions and carry real error. Treat the direction as informative and the decimals as indicative.
Sources
- Jäger R, et al. International Society of Sports Nutrition Position Stand: protein and exercise. J Int Soc Sports Nutr, 2017.
- Morton RW, et al. A systematic review, meta-analysis and meta-regression of the effect of protein supplementation on resistance training-induced gains in muscle mass and strength in healthy adults. Br J Sports Med, 2018.